
Massachusetts now has statewide land cover-adjusted soil organic carbon (SOC) maps that support carbon-informed land use decisions.
Download the desktop GIS-ready layers below to view current SOC stocks and compare them with potential SOC under an optimal land cover scenario.
Last updated: January 2, 2026
What’s included
This download includes:
- The SOCMA Final Report [PDF]
- Landcover SOC Conversion Table [CSV]
- Map Unit Landcover SOC Result Metadata [GPKG]
- Readme GIS data Soil Organic Carbon SOCMA 251203 [PDF]
- Desktop GIS-ready layers for:
- Current SOC (estimated under existing land cover)
- Potential SOC (estimated under optimal land cover)
- Three depth intervals: 0–30 cm, 0–100 cm, and full soil profile
How to use the layers
In ArcGIS Pro / QGIS:
- Download and unzip the file
- Drag the layer file into your map, or use Add Data
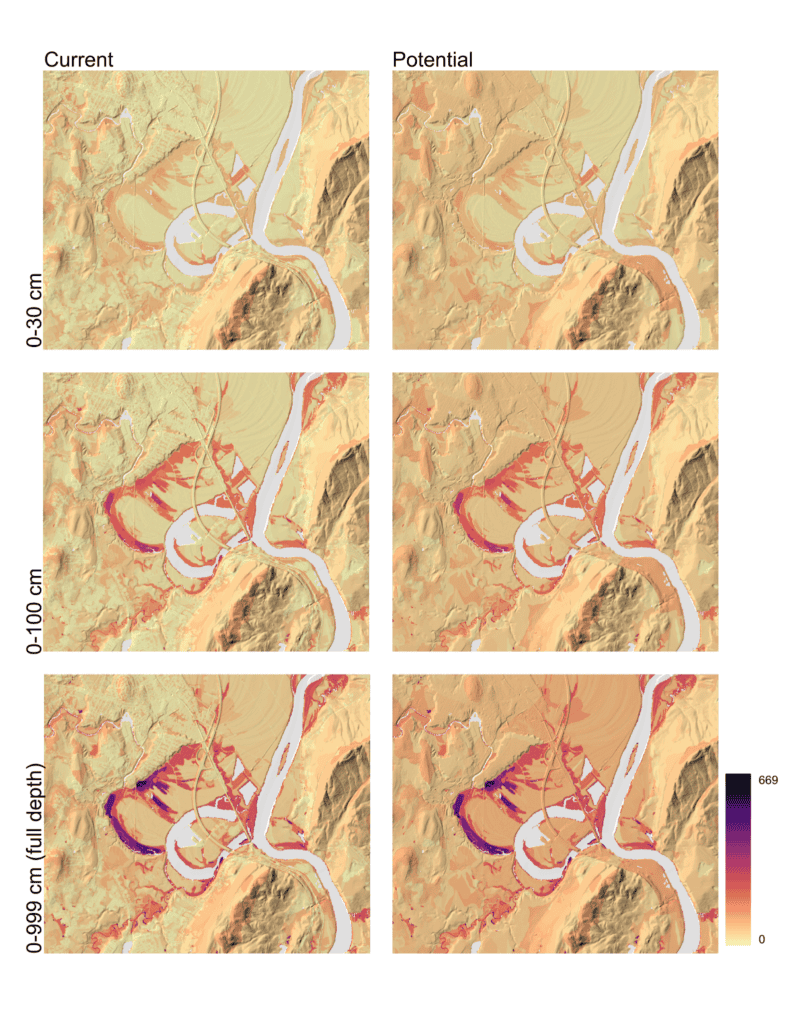
Example view: current vs potential SOC outputs across three depths (Northampton oxbow region). Values shown in metric tons per acre.
About the dataset
These layers were developed for Land Cover-Adjusted Soil Organic Carbon Mapping for Massachusetts, funded by the Massachusetts Healthy Soils Initiative. The maps integrate USDA-NRCS SSURGO soils data with 2016 Massachusetts land cover to estimate SOC density at 1-meter resolution across the state.
Use notes and limitations
Please note:
- These layers represent modeled estimates, not direct field measurements at each location.
- The analysis uses SSURGO data collected across multiple decades combined with 2016 land cover, which introduces temporal uncertainty.
- Conversion factors may not apply in every context (for example, wetlands are treated as a special case).
Contact
Questions or troubleshooting help: Contact Regenerative Design Group